

 Español
 Català
 Deutsch
 Français
 Português
 Italiano
 Nederlands
 Polski
Where the module sits inside Inventory
Everything the module adds hangs off the Inventory app. The Odoo Apps listing sums it up in its heading Warehouse route exceptions in one dashboard: your warehouse route exceptions gathered on a single dashboard. These questions walk through what you will find once it is installed, menu by menu, and point out what you should check for yourself on a test database.
What menus does the module add to Odoo?
One main menu, Inventory › Route Exceptions, with five entries beneath it. They are all inside Inventory, with these names and in this order:
Inventory › Route Exceptions › Route Exception DashboardInventory › Route Exceptions › All Route ExceptionsInventory › Route Exceptions › Trend ReportInventory › Route Exceptions › Scan LogsInventory › Route Exceptions › Route Exception Settings
What do you see in Route Exception Dashboard?
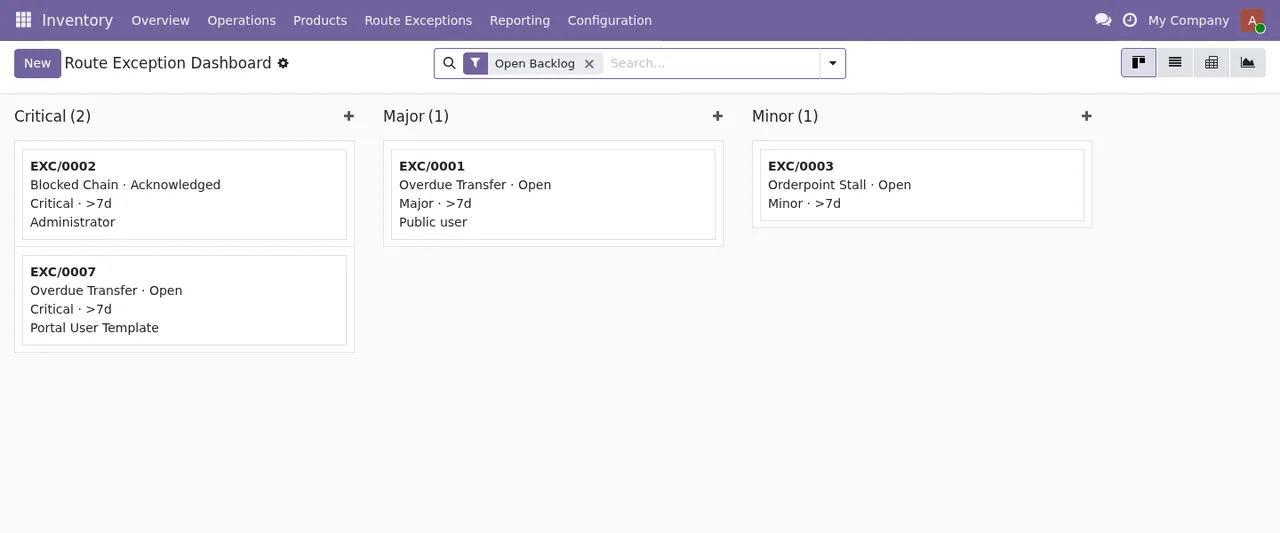
A kanban board. In the screenshot, with the Open Backlog filter applied, the cards are split into columns by severity (Critical, Major and Minor) and each card shows the exception type, its status, its age and the person responsible. This is the screen that matches the listing's heading: open exceptions at a glance, grouped by severity.
And what does All Route Exceptions give you?
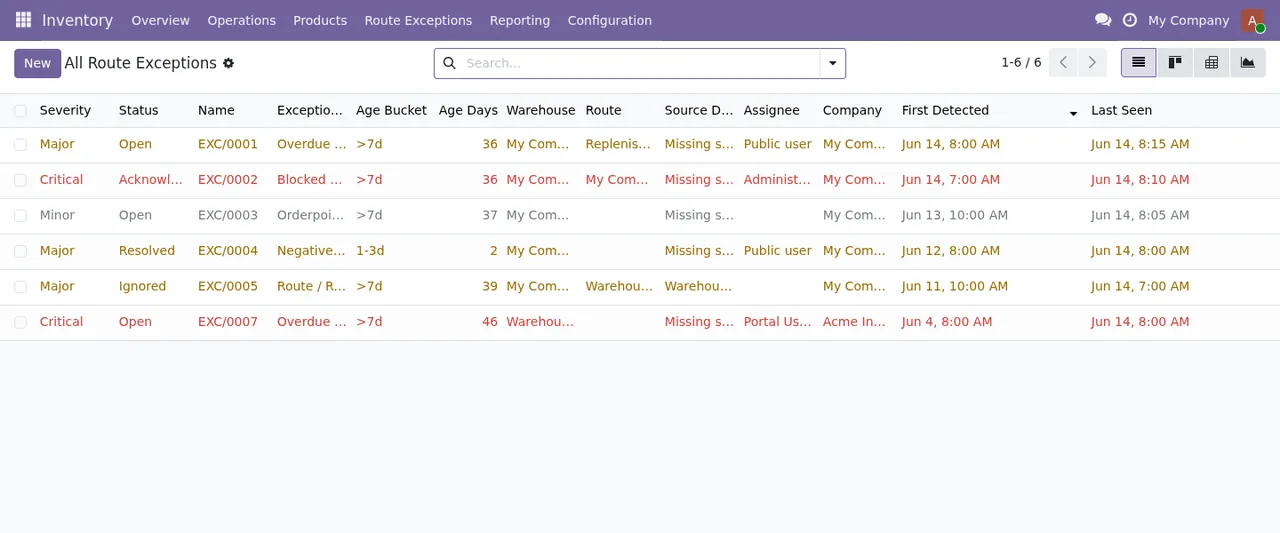
A list of every exception. In the screenshot there are columns for severity, status, age, warehouse, route, assignee and dates, and the rows are coloured by severity. If you want to find a specific exception by warehouse or by route, those are the columns in front of you.
What does Trend Report show?
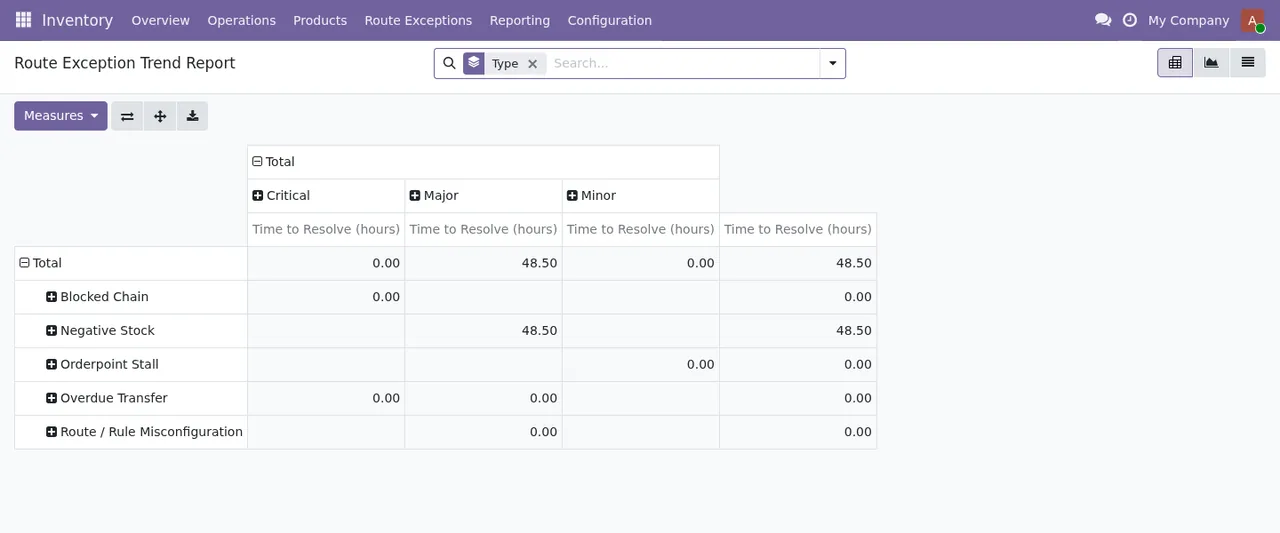
In the screenshot, a pivot table for the Route Exception Trend Report with the Type filter: Critical, Major and Minor columns, rows per exception type and the Time to Resolve (hours) measure. In other words, you cross type with severity and read the time to resolution, in hours.
What runs on its own and what gets recorded
Which scheduled actions does the module include?
Two, and both are listed as active:
Route Exception Detection Scan: runs every hour.Route Exception Housekeeping: runs every day.
The module also defines a service called Route Exception Detection Service (model flexigo.route.exception.detector). If you need to know exactly what the action checks in your warehouse, let it run on a test database and then look at the dashboard and the list.
What is in Scan Logs?
The menu lives at Inventory › Route Exceptions › Scan Logs. The module also includes a flexigo.route.exception.scan.log model, named Route Exception Scan Log. Open it on your test database and see what it holds before deciding who on the team will check it.
Where do you configure the module?
In Inventory › Route Exceptions › Route Exception Settings. The configuration is its own model, flexigo.route.exception.config, named Route Exception Detection Configuration. At the end of the animation you can see the settings list with a single record, Default Route Exception Settings, with its scan interval, a value and a ticked checkbox (some columns are cut off at the edge).
What an exception goes through and which versions are available
What does an exception go through from the moment it appears until it is closed?
Each exception is a record of the flexigo.route.exception model, named Warehouse Route Exception. The screens show: in the list, the status, the age and the assignee; on the dashboard cards, the type, the status, the age and the owner; and in the report, the time to resolution in hours. To learn the full journey in your own setup, take an exception on the test database and follow its status column in the list and its card on the dashboard until it no longer appears under the Open Backlog filter.
Which Odoo versions is it available for, and what does it cost?
It is published on Odoo Apps for 17.0, 18.0, 19.0 and 20.0. According to each version's listing it costs €9 per Odoo version, a one-off payment excluding VAT, for 17, 18, 19 and 20. You will find the details on the Odoo Apps listing and on the module page at flexigotech.com.
How FlexigoTech can help
At FlexigoTech we implement Odoo 17, 18, 19 and 20 and build bespoke connectors and integrations. If you are setting up Inventory and want this dashboard to be part of the implementation, or you need something bespoke around your routes, we can look at it with you.
Keep reading
Checked in the module's source code (version 20.0) and the linked sources
Sources
- Module source code: flexigo_warehouse_route_exception_dashboard 20.0 (8c481836): views/menu_views.xml
- Module source code: flexigo_warehouse_route_exception_dashboard 20.0 (8c481836): data/route_exception_cron.xml
- Module source code: flexigo_warehouse_route_exception_dashboard 20.0 (8c481836): static/description/index.html
- Module source code: flexigo_warehouse_route_exception_dashboard 20.0 (8c481836): models/route_exception.py
- Module source code: flexigo_warehouse_route_exception_dashboard 20.0 (8c481836): models/route_exception_config.py
- Module source code: flexigo_warehouse_route_exception_dashboard 20.0 (8c481836): models/route_exception_detector.py
- Module source code: flexigo_warehouse_route_exception_dashboard 20.0 (8c481836): models/route_exception_scan_log.py
- apps.odoo.com/apps/modules/20.0/flexigo_warehouse_route_exception_dashboard
- apps.odoo.com/apps/modules/17.0/flexigo_warehouse_route_exception_dashboard
- apps.odoo.com/apps/modules/18.0/flexigo_warehouse_route_exception_dashboard
- apps.odoo.com/apps/modules/19.0/flexigo_warehouse_route_exception_dashboard
- flexigotech.com/en/services.html